Read more
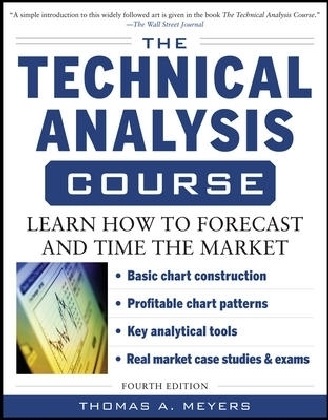
The Classic Introduction to Technical Analysis--Fully Updated and Revised!
The most reliable method for forecasting trends and timing market turns, technical analysis is as close to a "scientific" trading approach as you can get-and it is particularly valuable in today's volatile markets. The Technical Analysis Course , Fourth Edition, provides the know-how you need to make this powerful tool part of your overall investing strategy.
Through a series of lessons and exams, you'll master the techniques used by the most successful technical analysts in the market today. Updated with hundreds of real market examples, The Technical Analysis Course provides the essential foundation for using time-tested technical analysis techniques to profit from the markets. You'll learn how to:
Identify profitable chart patterns, including reversals, consolidation formations, and gaps
Utilize key analytical tools, including trendlines and channels, support and resistance, relative strength analysis, and volume and open interest
Perform advanced analysis using moving averages, trading bands, Bollinger Bands, oscillators, the Relative Strength Index, stochastics, and moving average convergence-divergence
Purchase stocks, bonds, futures, and options when prices are near their bottoms and sell when prices are close to their highs
Critical Acclaim for THE TECHNICAL ANALYSIS COURSE
"If you are a neophyte in the markets, this may be the book for you. It won't turn you into an overnight market wizard. You will, however, acquire an excellent grasp of market terminology and be a step ahead toward trading success and fortune."
-- Technical Analysis of Stocks & Commodities
List of contents
How to Take this Course ; Part 1: INTRODUCTION ; Chapter 1. The Philosophy of Technical Analysis; Part 2: CONSTRUCTING CHARTS ; Chapter 2. Basic Chart Construction; Part 3: PROFITABLE CHART PATTERNS ; Chapter 3. Major Reversal Chart Patterns; Chapter 4. Consolidation Formations; Chapter 5. Gaps; Part 4: KEY ANALYTICAL TOOLS ; Chapter 6. Trendlines and Channels; Chapter 7. Support and Resistance; Chapter 8. The True Value of Failed Signals; Chapter 9. Relative Strength Analysis; Chapter 10. Volume and Open Interest; Part 5: ADVANCED ANALYSIS ; Chapter 11. Using Moving Averages; Chapter 12. Trading Bands and Bollinger Bands; Chapter 13. Confirmation and Divergence; Chapter 14. Oscillators; Chapter 15. Relative Strength Index; Chapter 16. Stochastics; Chapter 17. Moving Average Convergence-Divergence Part 6: PUTTING IT ALL TOGEATHER ; Chapter 18. A Structured Approach to Technical Analysis; Chapter 19. A Final Case Study; Part 7: FINAL EXAM ; APPENDIX A; APPENDIX B; APPENDIX C; APPENDIX D; INDEX ;
About the author
McGraw-Hill authors represent the leading experts in their fields and are dedicated to improving the lives, careers, and interests of readers worldwide
Summary
New ways to forecast trends and time the market using the “scientific” approach of technical analysis

